
Montmorency Falls carries 115.3 m³/s in an average May and 8.5 in February. That is the widest swing among the six rows below that rest on a river gauge, and it is the exception. At Niagara, the river that feeds the falls stays between about 3% below and 5% above its 12-month average all year. Between those two cases sit the 21 rows of the table.
Six of the 21 rows rest on a river gauge near enough to the falls to count. The other fifteen are estimates from rainfall at a weather station, and our one test of that method went badly. Against measured flow it put 3 to 9 months of the year in the wrong class, 5.3 on average, in six comparisons, all of them in Hawaii. We kept the estimates, marked each one, and ask you to read them as a rain calendar and not as a flow measurement. Rows with a gauge say Measured in their note.
If you book a tour from a category linked in the table, such as Maui, Krka or Montmorency Falls, we earn a commission at no extra cost to you. Nothing in a row changes because of that, and several rows say plainly that water is a weak reason to pick a month. How we are paid is written in our editorial policy.
What do most water and little water mean here?
Each month gets one of three labels. Most water means the month's average is at least 1.25 times the average of all twelve months. Little water means it is below 0.6 times. Everything between is usual flow. Both lines are our choice and not an agency's, and moving either one changes 4% to 6% of the cells in our working data. The stations, the thresholds and the failed test are set out on the method page, so this page can stay short on method.
Read most water as water, not as a good day. Where rain drives the flow, the month with the most water is also the month with the most rain falling on you, and for two rows the station recorded 300 mm or more in a single month: Bali in January at 345 mm (1961-1990 normal) and Phnom Kulen in September at 305 mm. We read that as a warning. A trail that is fine in the dry months may be closed or slick in those, and the table has no way to see it.

A peak month is the month with the most water. It is not always the month with the best visit.
Which month has the most water at 21 places?
Months are numbered 1 to 12 in each cell. Rows marked Measured use a river gauge; the others use rainfall at a weather station with a one-month lag.
| Month | 1 | 2 | 3 | 4 | 5 | 6 | 7 | 8 | 9 | 10 | 11 | 12 |
|---|---|---|---|---|---|---|---|---|---|---|---|---|
| Kauai: Wailua Falls Measured: South Fork Wailua River gauge, 1991-2020. March, November and December run highest, and no month drops below our 'little water' line in this record. | 1 | 2 | 3 | 4 | 5 | 6 | 7 | 8 | 9 | 10 | 11 | 12 |
| Kauai: Hanalei, north shore Measured: Hanalei River gauge, 1991-2020. March and November lead. June to August stay above the 'little water' line while running at about half of March. | 1 | 2 | 3 | 4 | 5 | 6 | 7 | 8 | 9 | 10 | 11 | 12 |
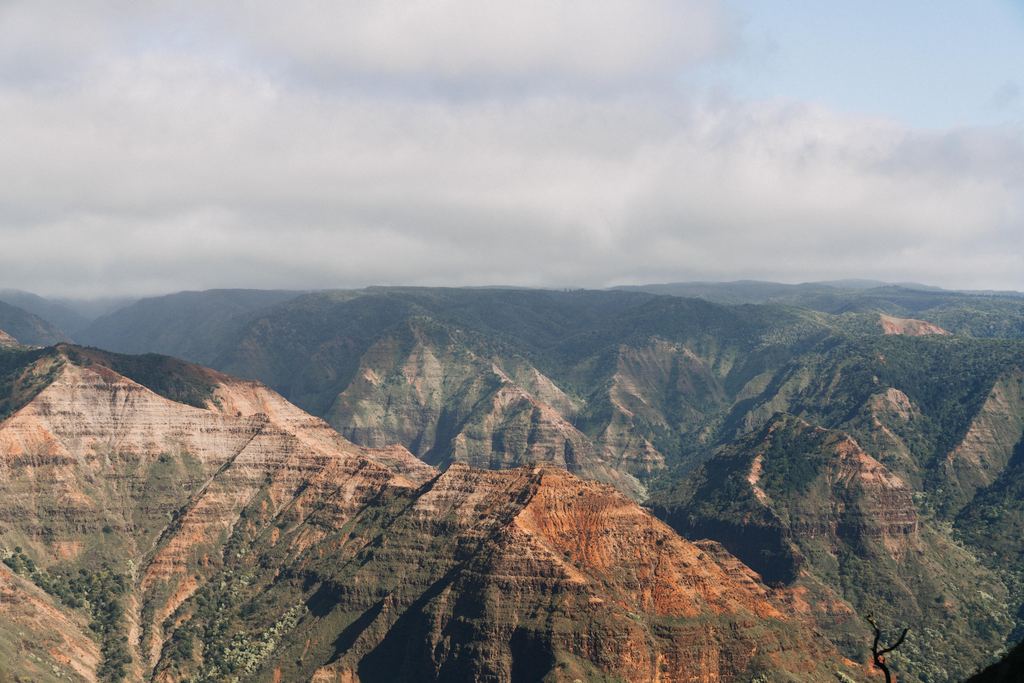
| Kauai: Waimea Canyon Measured: Waimea River gauge, record 1910-2026 because 1991-2020 has too few years. Leeward side: January averages 7.0 m³/s, June 1.0. The effect of irrigation intakes is not known to us. | 1 | 2 | 3 | 4 | 5 | 6 | 7 | 8 | 9 | 10 | 11 | 12 |
| Maui: Road to Hana Measured on Honomanu Stream near Keanae, record 1913-2026: one stream on the Hana road, not a specific fall. June and September sit just under the line (0.53 and 0.57 of the yearly mean). | 1 | 2 | 3 | 4 | 5 | 6 | 7 | 8 | 9 | 10 | 11 | 12 |
| Maui: Pools of Oheo Measured at Oheo Gulch near Kipahulu, 1991-2020, 24 yearly means. May and June sit at 0.51 and 0.56 of the yearly mean: 'little water', but only just. | 1 | 2 | 3 | 4 | 5 | 6 | 7 | 8 | 9 | 10 | 11 | 12 |
| Columbia River Gorge (Multnomah Falls) Rain estimate from Portland, one-month lag. The Forest Service says springs on Larch Mountain feed the fall and flow is usually highest in winter and spring, so read the shading as a hint only. | 1 | 2 | 3 | 4 | 5 | 6 | 7 | 8 | 9 | 10 | 11 | 12 |
| Krka National Park (Croatia) Rain estimate calculated by us from daily data at Knin. The park names November and March as highest and August as lowest. We have November and December on top, March 10th of 12, August at usual flow. | 1 | 2 | 3 | 4 | 5 | 6 | 7 | 8 | 9 | 10 | 11 | 12 |
| Plitvice Lakes (Croatia) Rain estimate calculated by us from Ogulin and Gospić daily data, whose monthly rainfall differs widely. The park speaks of autumn and spring and of ice in cold months, and names no flow months. | 1 | 2 | 3 | 4 | 5 | 6 | 7 | 8 | 9 | 10 | 11 | 12 |
| Kravica Falls (Bosnia) Rain estimate from Mostar, one-month lag. We found no flow series and no statement from the site about which months run strongest. | 1 | 2 | 3 | 4 | 5 | 6 | 7 | 8 | 9 | 10 | 11 | 12 |
| Bali - Sekumpul / Tegenungan Rain estimate from Denpasar on the south coast, 1961-1990 record; Sekumpul is in the north. January passes 300 mm at the station, which our flag treats as a warning, not a bonus. | 1 | 2 | 3 | 4 | 5 | 6 | 7 | 8 | 9 | 10 | 11 | 12 |
| Dunn's River Falls (Jamaica) Rain estimate from Montego Bay airport, about 100 km away. The least informative row here: the labels separate the months only weakly. March is the single 'little water' month. | 1 | 2 | 3 | 4 | 5 | 6 | 7 | 8 | 9 | 10 | 11 | 12 |
| Ban Gioc (Vietnam) Rain estimate from Lang Son, one-month lag. The Quây Sơn rises in China, so rain and any release upstream of the border are not in our data. | 1 | 2 | 3 | 4 | 5 | 6 | 7 | 8 | 9 | 10 | 11 | 12 |
| Ouzoud Falls (Morocco) Rain estimate from Marrakech, where the levels are far below the Middle Atlas towns (221 mm a year against 961 at Ifrane). The yearly shape carries over, the amounts do not: wet winter, dry June to September. | 1 | 2 | 3 | 4 | 5 | 6 | 7 | 8 | 9 | 10 | 11 | 12 |
| Phnom Kulen (Cambodia) Rain estimate from Siem Reap, record 1982-2024, which is not a standard normal. September passes 300 mm at the station. Peak here means water, not an easy day out. | 1 | 2 | 3 | 4 | 5 | 6 | 7 | 8 | 9 | 10 | 11 | 12 |
| Damajagua (Dominican Republic) Rain estimate from Santiago, one-month lag. May and November lead and no month falls to 'little water', so this row will not help you choose a month. | 1 | 2 | 3 | 4 | 5 | 6 | 7 | 8 | 9 | 10 | 11 | 12 |
| Erawan (Thailand) Rain estimate from Kanchanaburi, one-month lag. The wet months top the row, but visitors come for the pools, and this table cannot say whether they are clear. | 1 | 2 | 3 | 4 | 5 | 6 | 7 | 8 | 9 | 10 | 11 | 12 |
| Madeira (Risco, 25 Fontes, levadas) Rain estimate from Funchal, on the coast; the levada falls are in the mountains. The shape of the year transfers, the millimeters do not. Winter months dominate. | 1 | 2 | 3 | 4 | 5 | 6 | 7 | 8 | 9 | 10 | 11 | 12 |
| Trafalgar Falls (Dominica) Rain estimate from Canefield, on Dominica's leeward west coast, so the mountains likely get more than the station shows. 'Little water' in March to May describes the coast. | 1 | 2 | 3 | 4 | 5 | 6 | 7 | 8 | 9 | 10 | 11 | 12 |
| Medellin / Antioquia (Colombia) Rain estimate from Olaya Herrera, in the city. The two wet spells show as peaks in May and in October and November; February is the only 'little water' month. | 1 | 2 | 3 | 4 | 5 | 6 | 7 | 8 | 9 | 10 | 11 | 12 |
| Materuni (Tanzania) Rain estimate from Kilimanjaro Airport, at a different altitude from the village. The long rains show as March to May; July to October is 'little water'. | 1 | 2 | 3 | 4 | 5 | 6 | 7 | 8 | 9 | 10 | 11 | 12 |
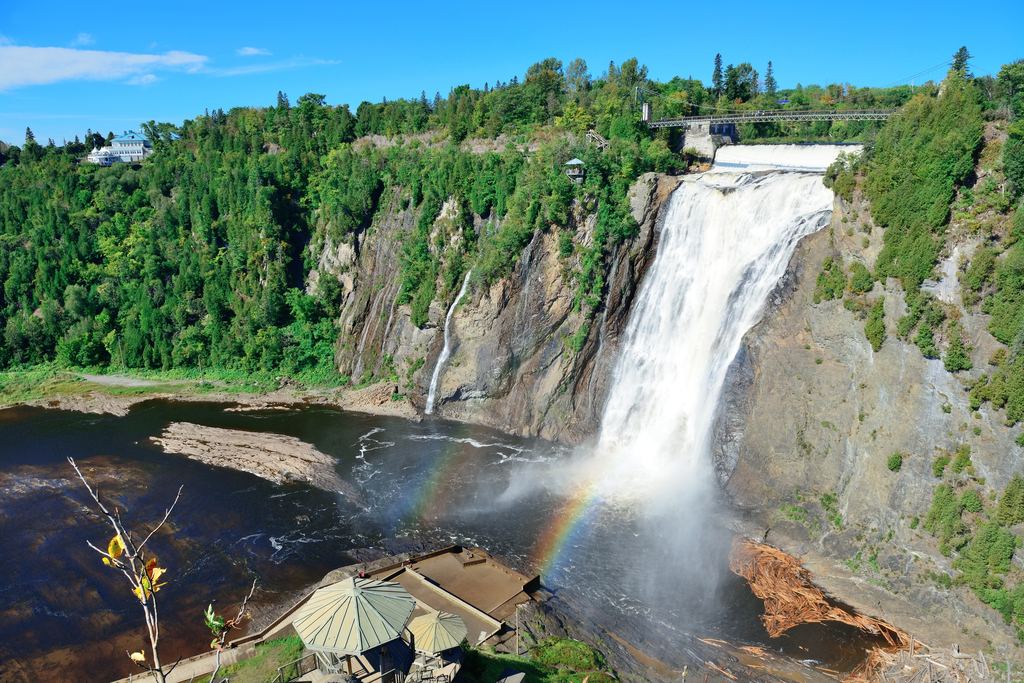
| Montmorency Falls (Quebec) Measured: Water Survey of Canada gauge 0.6 km below the Marches Naturelles dam, 1991-2020. May averages 115.3 m³/s, February 8.5. January to March is a low, cold river, not an empty one. | 1 | 2 | 3 | 4 | 5 | 6 | 7 | 8 | 9 | 10 | 11 | 12 |
Gauges (USGS, WSC) and climate normals, mostly 1991-2020. Exceptions: Waimea 1910-2026, Honomanu 1913-2026, Bali 1961-1990, Phnom Kulen 1982-2024. Krka, Plitvice are ours.
Three things the shading hides. First, Montmorency's little water from January to March describes a low river in a cold month. The fall is still there. Second, Wailua, Hanalei and Damajagua have no little-water month at all, which means the table cannot help you pick a month there. Third, usual flow covers a wide range: Hanalei's June to August average about half of its March flow and still sit in the same band as the months around March.
How big is the swing at Montmorency?
The Water Survey of Canada publishes monthly mean flow for station 02PD002, on the Montmorency River upstream of the fall. We computed the 1991-2020 means from its open data feed, read on 2026-10-27. January is 11.9 m³/s, February 8.5, March 10.3, then April jumps to 55.9 and May to 115.3 before June falls back to 42.4, July to 30.3 and October rises again to 39.3, a shape that looks like a snowmelt river but that a gauge alone cannot prove.
The gauge sits 0.6 km below the Marches Naturelles dam. We have not checked how much the dam shapes the monthly means. Snowmelt looks like the driver of the April and May figures. We call it a guess. The ice in winter is a different attraction, which the table does not measure.
Which rows rest on a river gauge?
Six. Each uses a station of the US Geological Survey or the Water Survey of Canada, and the table below gives the wettest and driest month of the record we used, which for Waimea and Honomanu is the whole record because 1991-2020 holds fewer than 15 annual records at those gauges. The Hawaiian gauges are in streams, at or near the places named, not at the falls themselves.
| Row | Gauge and record | Wettest month | Driest month |
|---|---|---|---|
| Wailua Falls, Kauai | South Fork Wailua River near Lihue, 1991-2020, 30 yearly means | March, 6.4 | May, 2.9 |
| Hanalei, Kauai | Hanalei River near Hanalei, 1991-2020, 29 yearly means | March, 9.3 | August, 4.8 |
| Waimea Canyon, Kauai | Waimea River near Waimea, 1910-2026, 74 yearly means | January, 7.0 | June, 1.0 |
| Road to Hana, Maui | Honomanu Stream near Keanae, 1913-2026, 54 yearly means | December, 0.9 | June, 0.3 |
| Pools of Oheo, Maui | Oheo Gulch near Kipahulu, 1991-2020, 24 yearly means | March, 2.3 | May, 0.7 |
| Montmorency Falls, Quebec | Montmorency River, WSC 02PD002, 1991-2020, 30 yearly means | May, 115.3 | February, 8.5 |
The raw statistics come from the USGS statistics service. Flow in a stream is not flow over a fall. A gauge upstream of a diversion, or below one, can tell a different story from the cliff edge. That is why the table gives gauge rows no more weight than their note allows.
Does Kauai have a low season?
It depends which side. On the two windward gauges, Wailua and Hanalei, no month of 1991-2020 falls below our little-water line. On the Waimea River, which drains the leeward canyon, May to October all fall below it, and June averages 1.0 m³/s against 7.0 in January. The National Weather Service in Honolulu says the islands' heaviest rains come from winter storms between October and April, in its climate summary, which fits the leeward pattern.
Our rain test for the leeward side was the worst of the six: rainfall at Lihue and the Waimea River agreed on only 3 months out of 12, and that is the number to keep in mind for every rain-based row elsewhere in the table.
Where does the table disagree with the parks?
Krka National Park writes, in its notice on the record water level of May 2023, that the highest water levels are usually recorded in November and March and the lowest in August. Our estimate for the Krka row, calculated by us from daily data at Knin, puts November and December on top, ranks March 10th of 12, and keeps August at usual flow. It misses March and it does not see August as low. If the two differ, trust the park.
Multnomah is another case. The Forest Service describes the fall as fed by underground springs from Larch Mountain, with a flow that varies and is usually highest in winter and spring, in a page we read through an archived copy of July 2025 because the live page refused our request. Our row for the Columbia River Gorge uses rain at Portland and marks November to February as most water. A spring-fed fall and a rain estimate do not fit well. At Plitvice the park speaks of autumn and spring and of ice in cold months, and gives no flow months, so that row is ours alone. Dunn's River is the weakest row: the station is some 100 km away and the labels barely separate the months.
When a park's sentence and our label disagree, the sentence wins.
Which famous falls are not in the table?
Nine lines below cover the places left out or never classified. The reasons differ. Each one is stated. Two of them, Dettifoss and Victoria Falls, were in an earlier draft of the data and came out once we saw how thin the sources were. The rest never had enough to classify. The method page gives the full list and the stations behind it.
| Place | Why it has no row | What we can say |
|---|---|---|
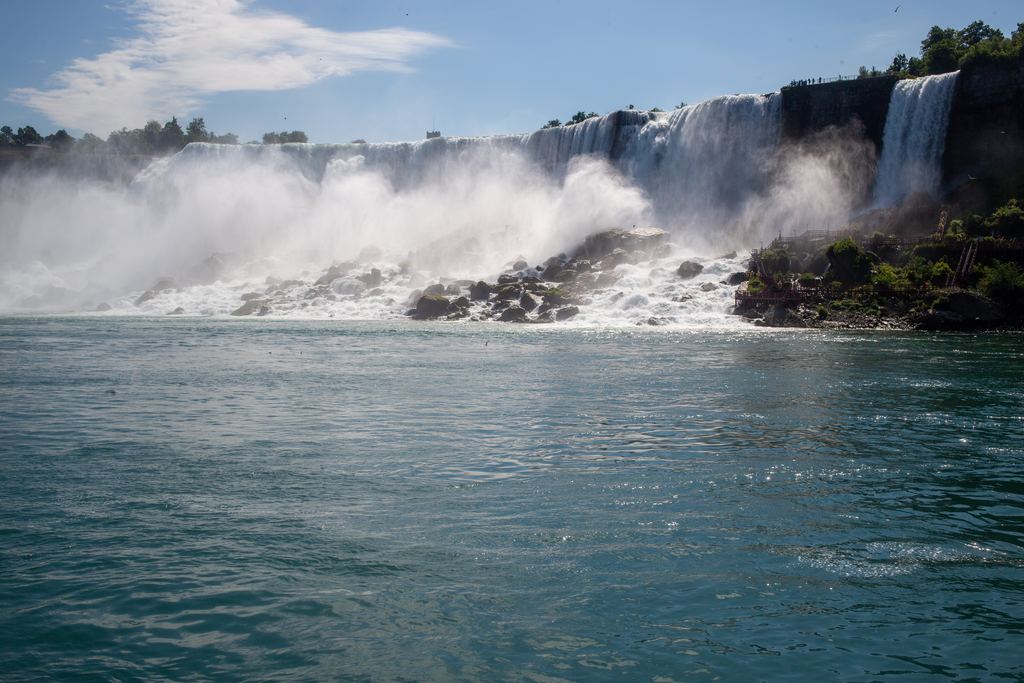
| Niagara | The USGS gauge at Buffalo measures the river that feeds the falls, not the water going over them. Its monthly means stay within about 3% below and 5% above the 12-month mean. | Niagara Parks says about 85 million liters a minute pass over the falls in winter and about 170 million from April to October. |
| Iguazú | No official source we opened gives the months of high water, and the nearest station does not reproduce the floods the Argentine press places in June (2014 and 2025). | Treat it as events, not a calendar. |
| Victoria Falls | The one sourced cell was a rafting-season phrase, August to January, in a 2017 document on a dam project. The rest came from Wikipedia and operator sites. | The Zambezi River Authority gives a long-term mean of 1,100 m³/s at Victoria Falls. That is a yearly average, not a month. |
| Dettifoss | The Icelandic Met Office describes one water year, 2009/10, not a climate record. | In that year, spring melt from the highlands began in early May and glacier melt in June. |
| Tumpak Sewu | Guides advise the dry season for access, while the rain record puts the most water in the wet season. Without a flow series the two cannot be reconciled. | Nothing on flow. The access advice is the guides', not ours. |
| Seljalandsfoss and Skógafoss | Rain and glacier melt both feed them and offset each other, and no open flow series separates the two. | Nothing on flow. |
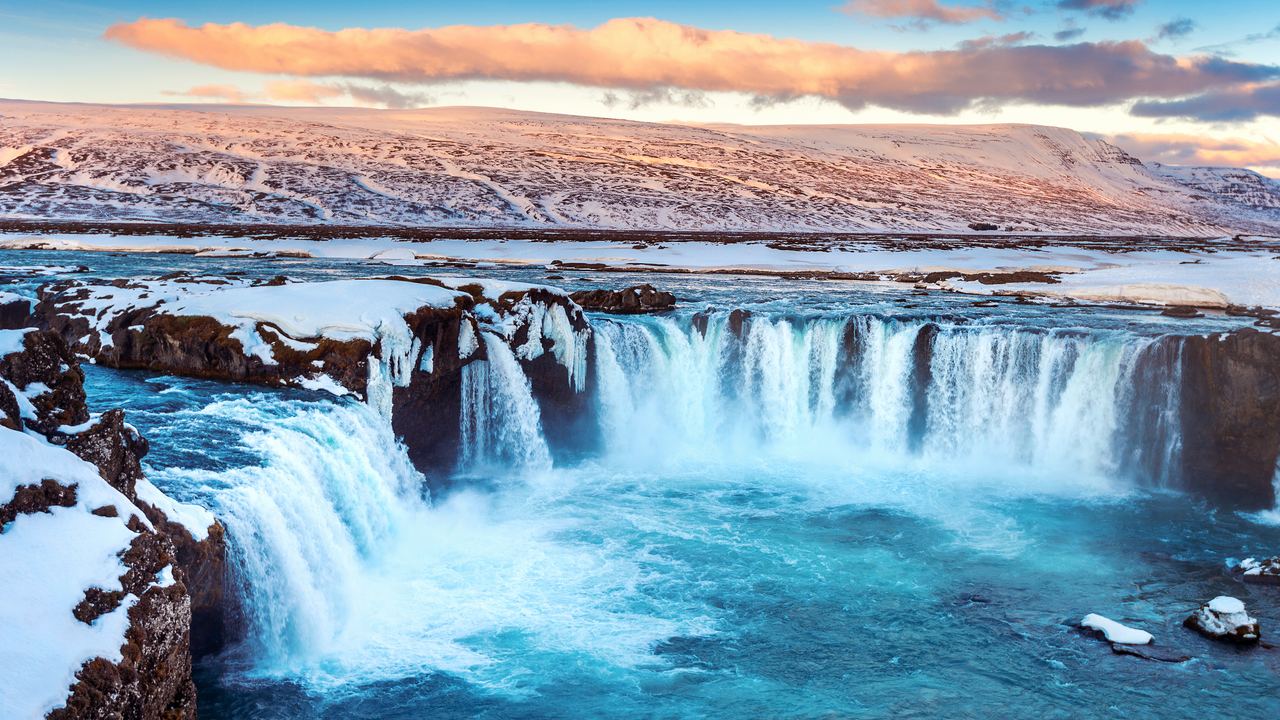
| Goðafoss | No open source on the regime of the river above it. | Nothing on flow. |
| La Fortuna and Río Celeste | The only usable station is on the Caribbean coast at Puerto Limón, and its rainy months do not match what local sources describe. | Nothing on flow. |
| Wadi Shab | The pools may be perennial, which we could not verify, and a coastal station's rain does not describe a wadi. | Nothing on flow. |
Our Niagara guide explains why a treaty and not the seasons sets the water over that fall. For Iguazú and Victoria, who stands on which side matters more than the month, and the comparison of the three border falls covers it. Snow and ice, including what happens at Dettifoss and Montmorency in winter, are in our guide to snowmelt and frozen falls, and the conflict at Tumpak Sewu is in the guide to how falls get their water.
Does the year matter more than the month?
Often. These averages cover a 30-year window, and a single year can sit far outside them. On 16 May 2023 the water level at Skradinski buk on the Krka reached 254 cm, the highest recorded since measuring began, above the previous 223 cm of 7 December 2005, and the park closed certain sections to the public for the first time in its history (Krka National Park). May is not one of the two months the park names as usually highest.
A river bulletin shows the same thing on a smaller scale. The Zambezi River Authority bulletin gives 296 m³/s at its Victoria Falls station on 26 October 2026 and 223 on the same date a year earlier. We use the pair only to show how much one year differs from the last. When the month you can travel has the water you want one year and not the next, the answer is a live source: a gauge, a park notice, an operator's closure page. The guide to what to do when a fall is closed or dry lists where to look, and our guide to choosing a waterfall tour covers the cancellation terms worth checking before you pay.
How do you pick a month with this table?
- Find your place's regime in when does a waterfall have water: rain, snowmelt, springs or a regulated river.
- Read the row and its note. If the note says rain estimate, take the shading as a hint. If it says Measured, take them as a record of the past.
- In the week you travel, look at the live gauge or the park's notice. That reading is worth more than any average.
Start with the place. The same month that fills one fall can leave another a trickle, which is why the destinations we cover are listed in Where to go, and why each row of the table needs reading against its own regime and not against a global calendar.
More on timing
Four guides that sit under this table.
When does a waterfall have water?
Rain, snowmelt, springs and dams: four ways a fall gets its water, with a measured example for each.
How we classify a waterfall month
Thresholds, stations, a rain test that missed 5 months of 12 on average, and what the table cannot see.
Snowmelt, ice and frozen falls
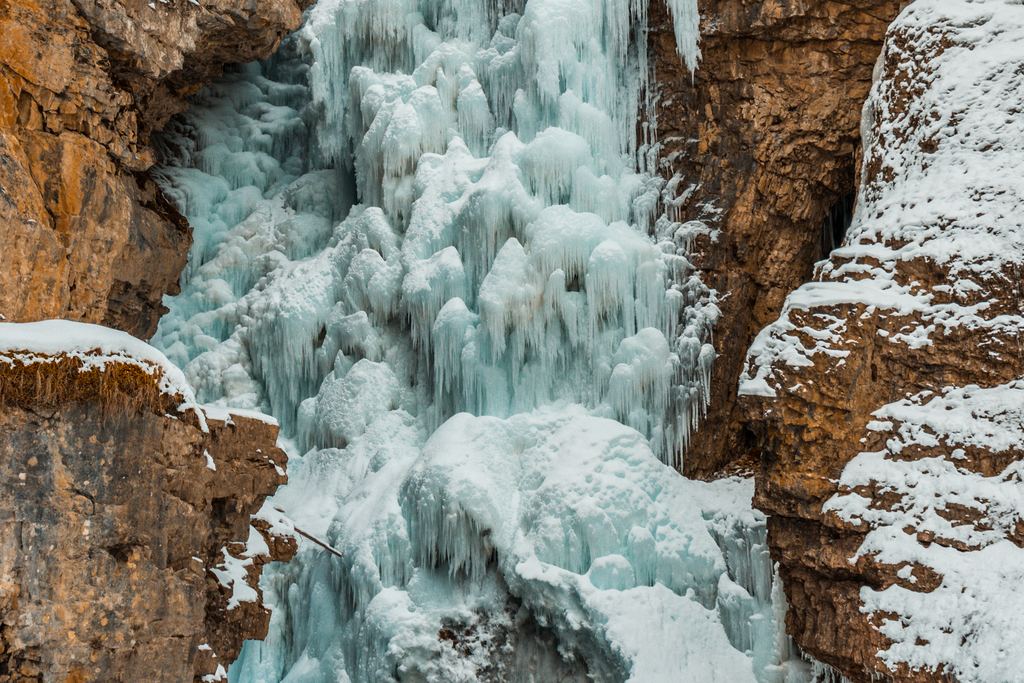
What winter does to the flow and the access at falls that freeze.

If the waterfall is closed or dry
Where to check today's water and what to do when the trip does not match.
Quick answers
Is the month with the most water the best month to visit?
Not by itself. The table labels water, not the visit. Where rain drives the flow, the wettest month also brings the most rain on the day, and parks close routes after floods. Krka closed sections in May 2023 at a record water level.
Does Niagara have a season with more water?
Not in the river that feeds it: USGS monthly means at Buffalo stay between about 3% below and 5% above the 12-month mean (1991-2020). Over the falls, Niagara Parks gives about 85 million liters a minute in winter and about 170 million from April to October. The treaty behind that is in our Niagara guide.
How reliable are the rain-based rows?
Weakly. In six comparisons against measured flow, all in Hawaii, the rain estimate put 3 to 9 months in the wrong class, 5.3 on average. Fifteen of the 21 rows use it. The six rows with a gauge say Measured in their notes.
Which Kauai months have little water?
On the windward gauges, none: Wailua and Hanalei stay above our little-water line in every month of 1991-2020. On the Waimea River, which drains the leeward side, May to October fall below it (record 1910-2026).
Data verified on . Gauge data from USGS and the Water Survey of Canada, park and agency pages read 2026-10-27. Check the official site or a live gauge before you go. How We Classify a Waterfall Month: Method, Sources and Limits
Check the water the week you go
We earn a commission if you book through this link. Montmorency is the one place here where a gauge shows how much the season matters.