
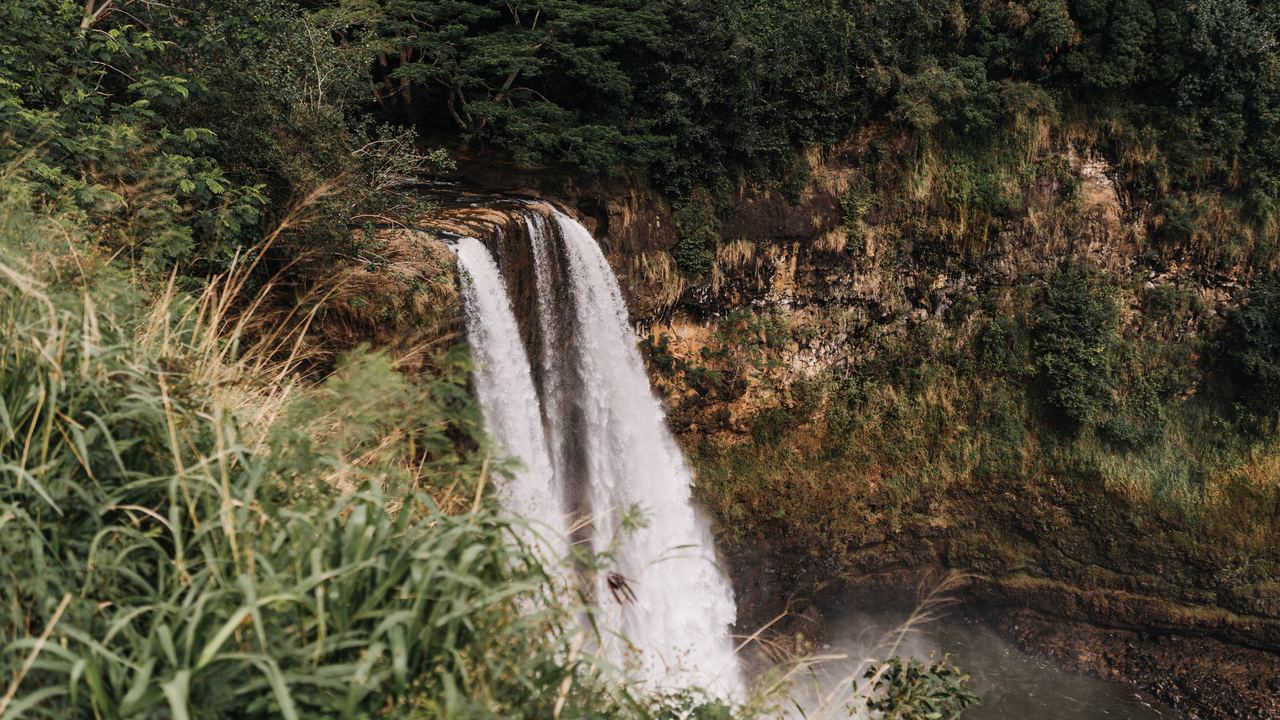
Some waterfalls do dry up, and the ones that do share a feed, not a climate. A waterfall runs on four kinds of supply: rain, snowmelt, springs, and a human decision about a dam or a power canal. Each has its own calendar, and each fails in its own way. Where winter storms fill the river, the summer can leave it at a quarter of its average. Where snow is the store, winter is the low season and May is the flood. A spring changes the flow less, but it still changes it. And where engineers divert the water, the schedule belongs to a power company and a treaty, not to the sky. This guide gives one measured example of each, with the gauge, the period and the source, so you can see what a month-by-month claim is made of. For the chart itself, go to our guide to when to visit waterfalls.
We earn a commission when you book a tour through the links on this site, at no extra cost to you. It does not change what we write, and this page mostly explains why a waterfall can look different on your day than in the listing photo. How we are paid is set out in our Editorial Policy. If you are comparing offers, how to read a waterfall tour listing is the better place to start.
How does a waterfall run out of water?
It runs out when whatever fills the river stops arriving. That is rarely the whole story, because most waterfalls sit on rivers with more than one source. The useful question for a trip is narrower: in which month does the supply change, and by how much? Gauges beat guesses. Every figure below comes from a stream gauge or from a park's own page, read on October 27, 2026, and the notes say where a number is shakier than it looks.
| Feed | Example | What the record shows |
|---|---|---|
| Rain | Waimea River, Kauai (USGS) | Monthly mean 7.0 m³/s in January and 1.0 m³/s in June, record 1910-2026 |
| Snowmelt | Montmorency River, Quebec (Water Survey of Canada) | 115 m³/s in May and 8.5 m³/s in February, 1991-2020 |
| Springs | Multnomah Falls, Oregon (U.S. Forest Service) | Flow varies and is usually highest in winter and spring; no gauge series read |
| Regulation | Niagara Falls (Niagara Parks) | About 85 million liters a minute over the Falls in winter, about 170 million from April to October |
Which waterfalls follow the rain?
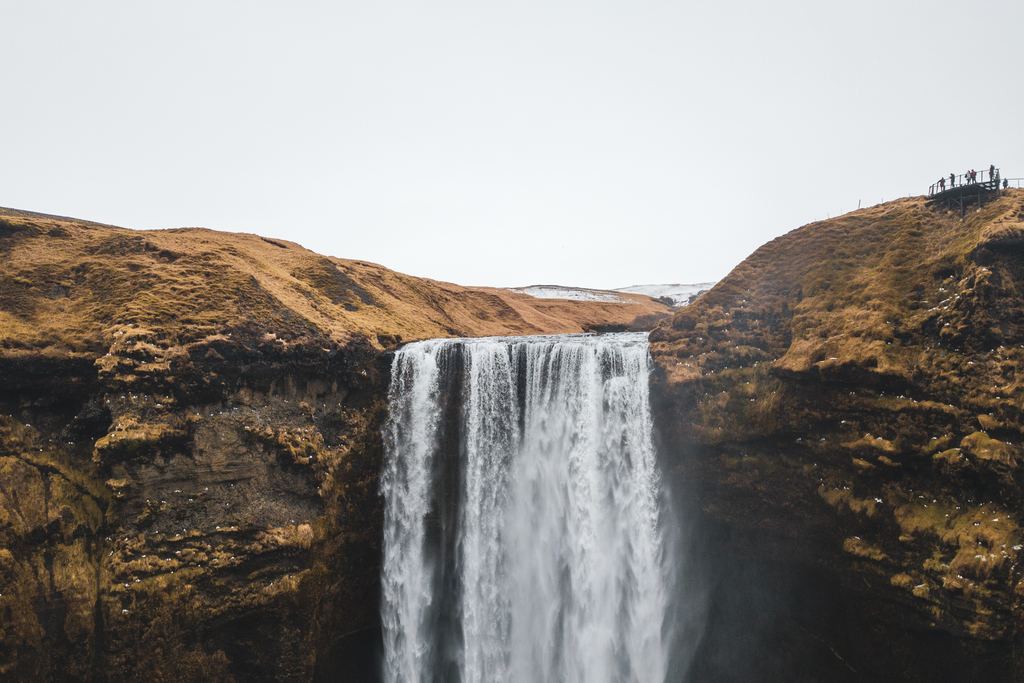
Hawaii is the cleanest case because the National Weather Service states it plainly. For most of the islands there are two seasons, a "summer" from May to October and a "winter" from October to April, and the heaviest rains come with winter storms. Leeward and other dry areas get most of their rain from a few of those storms, so their rainfall is seasonal and their summers are dry. Wetter regions, fed by storms and trade-wind showers alike, show much smaller seasonal differences. You can read it in the Honolulu office's climate summary.
The gauges agree, once converted from the cubic feet per second that USGS publishes. The station on the Waimea River near Waimea, on the leeward side of Kauai, has a monthly mean of 7.0 m³/s in January and 1.0 m³/s in June across its record from 1910 to 2026. The South Fork Wailua River and the Hanalei River sit on the wetter side and never fall that far. Over 1991-2020 the Wailua averages about 3.0 m³/s in its driest month, May, against 6.4 in March, and the Hanalei 4.8 in August against 9.3 in March. By our arithmetic the lowest month on either river is about three quarters of its annual mean. Waimea's lowest is about a quarter. Which side of the island you stand on matters.
Two cautions. USGS says its monthly statistics come from approved daily means and may not match its official publications. And we have not checked whether withdrawals upstream of the Waimea gauge shape its low months, so read the number as a record of the river, not as a measurement of any one waterfall. For a visit, the practical reading is that drier slopes can look very different in July than in January photos, while the wetter valleys keep a steadier flow.
Ask which month a listing photo was taken in. A waterfall photographed in its wettest month is not a promise about the day you arrive.
What does snowmelt do to a river?
The Montmorency River, which feeds the falls near Quebec City, is a snow river. The Water Survey of Canada station on it, 0.6 kilometers below the Marches Naturelles dam, has a 1991-2020 monthly mean of 8.5 m³/s in February and 115.3 m³/s in May. That is more than thirteen times as much water in the flood month. April averages 55.9 and June 42.4, and July to December sit between 22 and 39. Winter is low because the precipitation is stored as snow, which is our reading of the record and not a sentence from the agency. The station is on the river below a dam, not at the falls, and we have not checked how much the dam shapes those figures. Take it as the shape of the year. A record, not a promise. Our Montmorency Falls tours from Quebec City page lists the day trips that go there.
Yosemite National Park describes the same shape in words. Its waterfalls page, last updated May 12, 2026, says Yosemite Falls flows approximately November through July, with peak flow in May, and tells visitors to look for the ice cone at the base of the upper fall during winter. Yosemite is not in our catalog, but it shows how an operator talks about a snow-fed fall: a window of months, a peak, and an edge season on each side. What happens at the cold end of that window is the subject of our guide to frozen waterfalls and snowmelt.
Are spring-fed waterfalls always on?
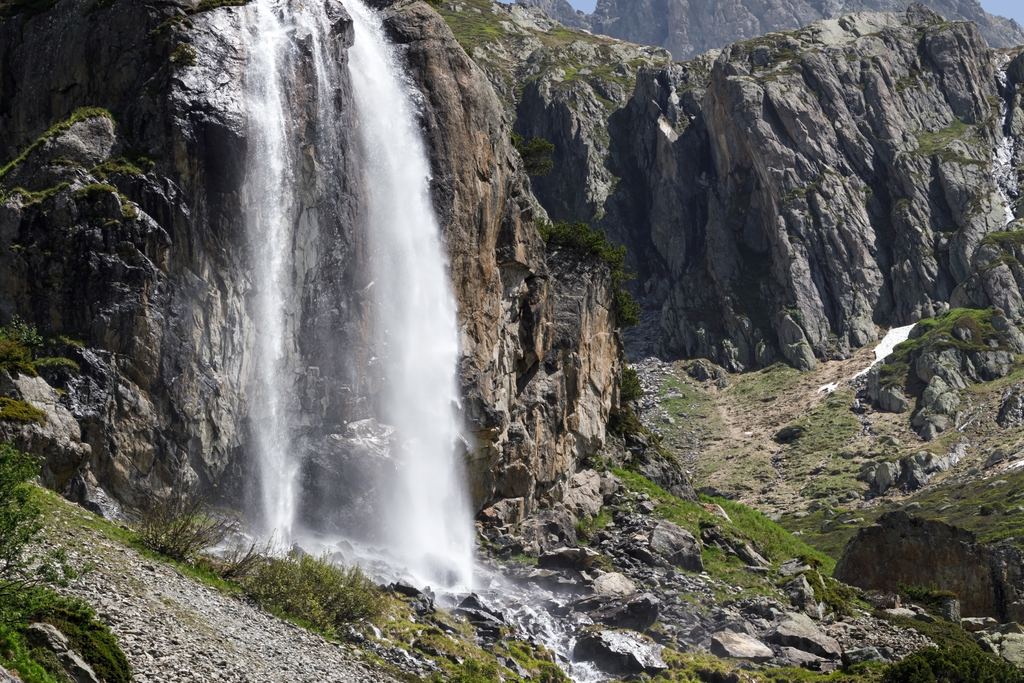
No, and the word spring misleads. The Forest Service page for Multnomah Falls, which we read from an archived copy dated July 31, 2025 because the original refuses automated requests, says the falls are fed by underground springs from nearby Larch Mountain, that the flow varies, and that it is usually highest in winter and spring. A spring gives a waterfall a floor, a flow it rarely drops under. It does not give it a flat calendar. Springs have seasons too.
Krka shows a delay you can check. The park says its Krka catchment receives about 1,250 millimeters of precipitation a year, mostly in winter, yet the park's own gauge record puts the highest water usually in November and March and the lowest in August. Rain and river do not move in the same month. The park publishes the record on its news page.
Can a dam change a waterfall's calendar?
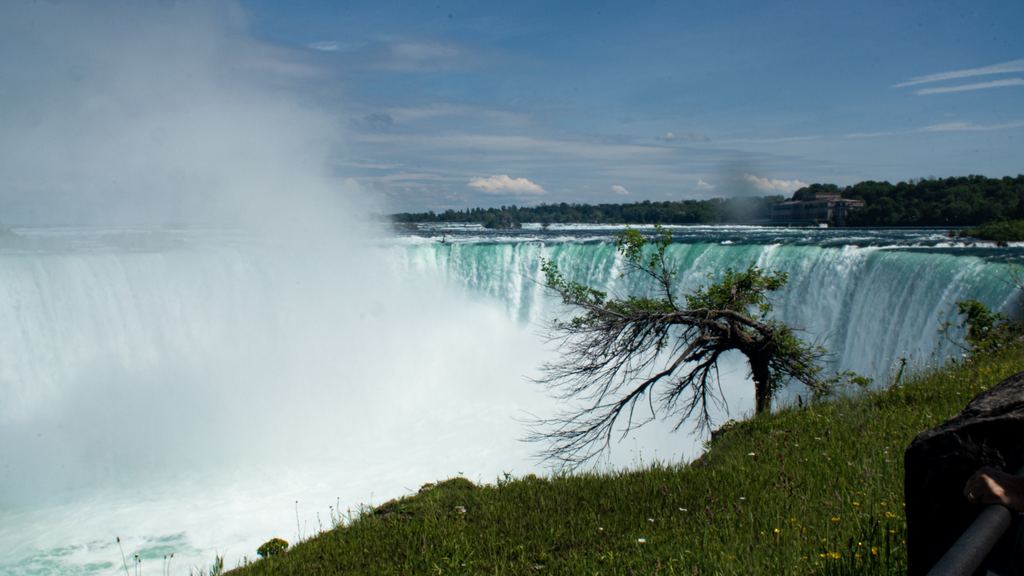
At Niagara it does. Niagara Parks says that in winter 75% of the water flowing from Lake Erie along the Niagara River is diverted about a kilometer before the Falls, which leaves a winter flow of approximately 85 million liters a minute over them. From April 1 through October 31 about 50% is diverted, and the summer flow is generally measured at 170 million. You can read both figures on its frozen falls page. The river itself barely moves. The USGS gauge at Buffalo, which measures the Niagara River as it leaves Lake Erie, has monthly means between 5,836 and 6,342 m³/s over 1991-2020, from about 3% below the annual mean to about 5% above. So the river has no spring peak, and the flow over the Falls is regulated into a summer setting and a winter setting. Both statements are true. They measure different things. The treaty behind the minimums has its own page: Niagara Falls, erosion and the 1950 treaty.
Victoria Falls shows the other end of the scale, a big river measured every day. The Zambezi River Authority publishes flows at its Victoria Falls station, and on October 26, 2026 the page gave 296 m³/s, against 223 on the same date a year earlier. The same page gives a long-term mean annual flow of 1,100 m³/s and a record low annual mean of 390, in the 1995/96 season. Setting a late-October day beside an annual mean tells you very little, which is why the guide to a closed or dry waterfall shows how to read these bulletins. For the two banks of the river, see which side to choose.
Does a rainy season mean a better visit?
Not automatically. More water arrives with the rain, and so do mud, closed trails and cloud. A Vietnam tourism site, which we could not confirm is the national authority, says September and October give the best combination of water volume and rice-harvest scenery at Ban Gioc, and that from December to April the falls lose most of their volume. A travel blogger writes that Tumpak Sewu in Java gains considerable volume in the rainy season, typically November to March, while the trails turn muddy and slippery. Both are secondary sources, so read them as local advice and not as measurements. They agree on one point: the month with the most water is rarely the month with the easiest access.
Single years matter more than months. On May 16, 2023, NP Krka recorded 254 centimeters at Skradinski buk, the highest level since measuring began. The previous high was 223 cm in December 2005, and the lowest was 5 cm on October 3, 1990. The park closed Skradinski buk and Roški slap and canceled all boat excursions, in a month that is not among its usual high ones. In October 2026 the concessionaire of Iguazú National Park reported 17.7 million liters per second on October 26, 11 times the historical mean it quotes, after heavy rain in the Iguazú basin. Floods like these are events, not seasons, and the closures that follow them are covered in if the waterfall is closed or dry. Our Niagara Falls tour pages are a steadier bet, since the flow there is managed.
How reliable is a month-by-month chart?
Less than it looks. For our own season matrix we compared monthly rainfall at the nearest weather station with the USGS gauge on the same island, and the two agreed on the month's class (peak, usual or low) in between 3 and 9 months out of 12, depending on the river. The match was best on the wetter side of Kauai and worst on the leeward Waimea and at Oheo Gulch on Maui. Where no gauge exists we use rainfall and say so. For Krka, the rainfall proxy reproduces the park's November high and August low but misses March, which the park lists as a high month. A chart built on rain is an approximation. The matrix marks which rows rest on gauges and which on proxies, and the method page gives the thresholds and the limits.
Quick answers
Do waterfalls dry up in summer?
It depends on the feed. On the leeward side of Kauai the Waimea River averages 1.0 m³/s in June against 7.0 in January, while snow-fed rivers such as the Montmorency run highest in late spring. At Niagara the flow over the Falls is about twice as large from April to October as in winter, because less water is diverted. Check the feed before you check the season.
Is a spring-fed waterfall always flowing?
It has a floor, not a flat calendar. The Forest Service says the springs feeding Multnomah Falls produce a flow that varies and is usually highest in winter and spring. We read that page from an archived copy dated July 31, 2025.
Is the rainy season the best time to see a waterfall?
It is the time with the most water, which is a different thing. Park and travel sources we read link high water to mud, slippery trails and closures. Read the operator's page for your dates and ask about trail conditions.
Where can I check a river's flow before I go?
Gauge networks such as USGS and the Water Survey of Canada publish daily and monthly series, and the Zambezi River Authority publishes its Victoria Falls station. Our guide to closed or dry waterfalls walks through them with dated examples.
Data verified on . Gauges: USGS 16031000, 16060000, 16103000, 04216000; WSC 02PD002. Park and operator pages read 2026-10-27. Check the official site before you go. Editorial Policy
Montmorency Falls, when the river is high
We earn a commission if you book through this link. Ask the operator what the water is usually like in your month.