
Our month-by-month table has 21 rows. Six come from a river gauge and fifteen from rainfall at a weather station. Ten more entries in our working data never made the table: five because we could not classify them, and five because a class would have said more than we knew. This page lists every rule, every threshold we picked ourselves and the test our rain estimate failed. We wrote it for the reader who wants to disagree with a cell and needs to know where to push.
Which four rules do we use?
Every place in the working data gets one of four rules. Q uses measured flow from a river gauge. R turns monthly rainfall at a weather station into an estimate of flow. C takes a calendar that a source states in words, when no numbers exist. ND means no class, with the reason written down. Rule C exists in the data but not in the published table. We removed both places that used it. The reasons are below.
| Rule | What it uses | Places in working data | Published in the table |
|---|---|---|---|
| Q | Monthly mean flow from a USGS or Water Survey of Canada gauge | 7 | 6 |
| R | Rainfall at a weather station, with a one-month lag | 17 | 15 |
| C | A calendar a source gives in words | 2 | 0 |
| ND | Nothing we trust enough to classify | 5 | 0 |
The seven Q places include Niagara, the Buffalo gauge of the river that feeds the falls, which we left out for reasons given on the main page, and the seventeen R places include Tumpak Sewu and Iguazú, left out for the same kind of reason. Both are also named in our guide to how falls get their water.
How does a month get its label?
For rules Q and R we divide each month's value by the average of all twelve months. The result is an index. An index of 1.25 or more earns the label most water. An index below 0.6 earns little water. Everything between is usual flow. Both numbers are ours. No agency publishes them, and nothing in the physics says a month at 1.24 is different from one at 1.26.
We moved each line to see what it does. Lowering the peak line to 1.15 changes 19 of the 312 monthly cells in the working data, raising it to 1.35 changes 14, lowering the little-water line to 0.5 changes 14 and raising it to 0.7 changes 16. Each line therefore decides between 4% and 6% of the cells. A first version used a fixed minimum of 30 mm of rain a month instead, and it sent every month of Marrakech, a station with 221 mm a year, to little water. We dropped it.
Which cells sit on the line?
The cells most likely to flip are the ones just under or just over a threshold. On Maui, Honomanu Stream in June and September sits at 0.53 and 0.565 of its yearly mean, and the Oheo Gulch gauge in May and June sits at 0.51 and 0.56. Dunn's River in March is another. The table prints them as little water, and each of those rows says so in its note. Those are the weak cells.
If you read a cell near the line as a fact, you will be wrong about as often as the line is arbitrary. We would rather say so than hide the edge.
How do we turn rain into flow?
Rule R takes the rainfall of a month and the month before it, averages the two, and treats the result as the flow. The lag is there because water takes time to reach a fall: rain on the last day of a month is mostly still on the hillside on the first of the next. We tested the idea wherever we had both a weather station and a gauge. The table below has the results. They are not flattering.
| Comparison | Correlation, same month | Correlation, one-month lag | Months in the same class (of 12) |
|---|---|---|---|
| Lihue rain and South Fork Wailua River, Kauai | 0.93 | 0.86 | 9 |
| Lihue rain and East Branch North Fork Wailua, Kauai | 0.92 | 0.88 | 9 |
| Lihue rain and Hanalei River, Kauai | 0.83 | 0.89 | 8 |
| Lihue rain and Waimea River, Kauai (leeward) | 0.73 | 0.90 | 3 |
| Hilo rain and Honomanu Stream, Maui | 0.49 | 0.66 | 8 |
| Kahului rain and Oheo Gulch, Maui | 0.79 | 0.59 | 3 |
| Buffalo rain and Niagara River at Buffalo | -0.12 | -0.26 | not applicable, the river is flat |
Read the last column as errors: 3, 3, 4, 9, 4 and 9 months out of 12, or 5.3 on average. Two of the six comparisons share a river system, and all six are in Hawaii, so the test says little about a limestone park in Croatia. The lag wins where the basin is large and slow, as at Hanalei, Waimea and Honomanu, and loses where it is small and quick, as at Wailua and Oheo. It is a compromise tuned on one archipelago. Niagara shows what happens when the river is regulated: rain at Buffalo explains none of it.
We kept the fifteen R rows anyway, because an empty row helps no one, and because a rain calendar still says something about monsoon and dry seasons. Each of those rows carries the words rain estimate in its note. If you discard all of them, the table loses fifteen rows and none of its gauge rows.
A rain estimate tells you when it rains. It does not tell you when the waterfall is full.
One place let us check against an official statement. Krka National Park says the highest water levels of the Krka are usually recorded in November and March and the lowest in August. Our estimate ranks November 2nd of 12, March 10th and August 12th. It finds one of the two park peaks and misses the other.
Which stations, and from which years?
Rule R needs a weather station, and we grade each station. Level A is a climate normal that a national weather service published for 1991-2020, which we read from the WMO normals archive at NOAA or from the service itself. Level B is a normal we calculated ourselves from daily records in the GHCN-Daily file for Knin. A month counts as valid with at most 10 missing days, or 3 for rain, and a calendar month needs at least 25 of the 30 annual records. Level C is anything outside the standard period or not a normal at all.
| Level | What it means | Rows | Examples |
|---|---|---|---|
| A | Normal published by a national service, 1991-2020 | 11 | Portland (Columbia Gorge), Marrakech (Ouzoud), Kanchanaburi (Erawan) |
| B | Calculated by us from daily records | 2 | Krka from Knin; Plitvice from Ogulin and Gospić |
| C | Outside the standard period or not a normal | 2 | Bali from Denpasar, 1961-1990; Phnom Kulen from Siem Reap, 1982-2024 |
The gauge rows use the USGS monthly statistics and the Water Survey of Canada feed. All use 1991-2020 except two Hawaiian gauges: Waimea (1910-2026) and Honomanu (1913-2026), which have fewer than 15 annual records in the standard period, so we used their whole record instead of a window too thin to trust. Our Level B method has been checked once, on a station in Ljubljana, for an earlier project on caves. It has not been checked in Croatia against anything but the park's one sentence.
Reuse terms are another limit. We have not confirmed them for the Portuguese, Icelandic, Croatian and Vietnamese weather services or for WMO's World Weather Information Service, so we publish monthly means and not their tables. NOAA and USGS data can be reused.
Why do some places have no class at all?
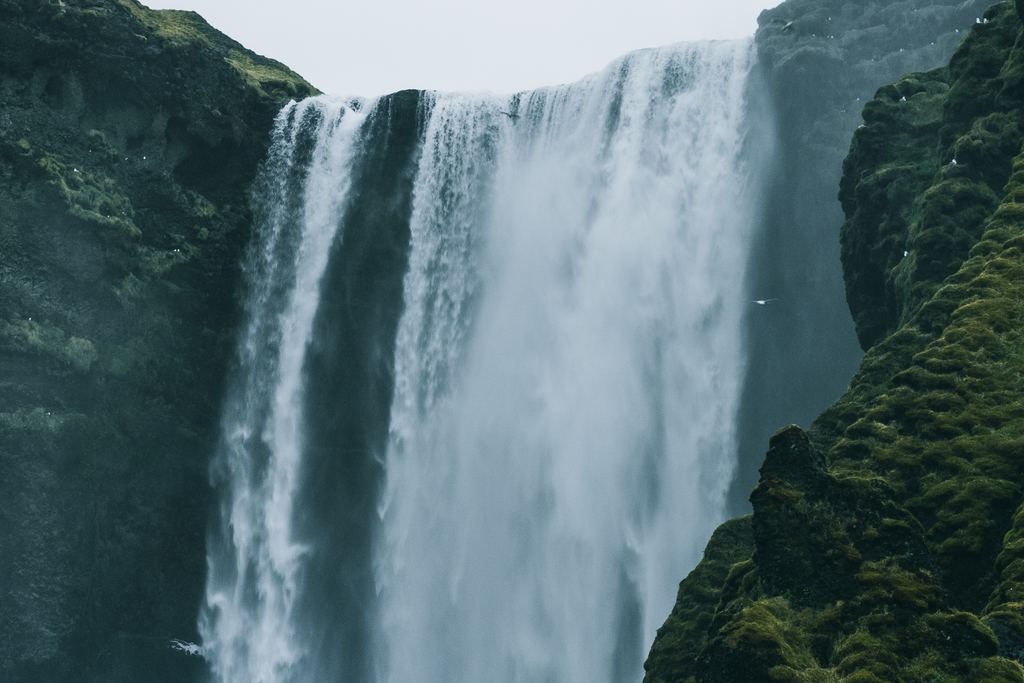
Five places stayed unclassified, and the working data holds a reason for each. Seljalandsfoss and Skógafoss are fed by rain and by melt from the Eyjafjallajökull glacier, and the two offset each other with no open flow series to separate them. For Goðafoss we found no open source on the regime of the river. The other three are in the table below.
Two were different. Dettifoss and Victoria Falls had rule C calendars in the data, and we removed both. For Victoria the only sourced cell was a phrase in a 2017 document on a dam project, which calls August to January the low-flow season in rafting terms, and nothing else we could read gave monthly numbers. For Dettifoss the Icelandic Met Office describes one water year, 2009/10, and says that in it spring melt from the highlands began in early May and glacier melt in June.
| Place | Reason |
|---|---|
| Seljalandsfoss and Skógafoss | Rain and glacier melt offset each other, and no open flow series exists. |
| Goðafoss | No open source on the regime of the river above the fall. |
| La Fortuna | The only usable station is on the Caribbean coast at Puerto Limón, and its pattern does not match what local sources describe. |
| Río Celeste | Same station problem, and the shade of the water depends on turbidity after rain, which no monthly normal captures. |
| Wadi Shab | Pools may be perennial, which we could not verify, and a coastal station's rain does not describe a wadi. |
What does the table not measure?
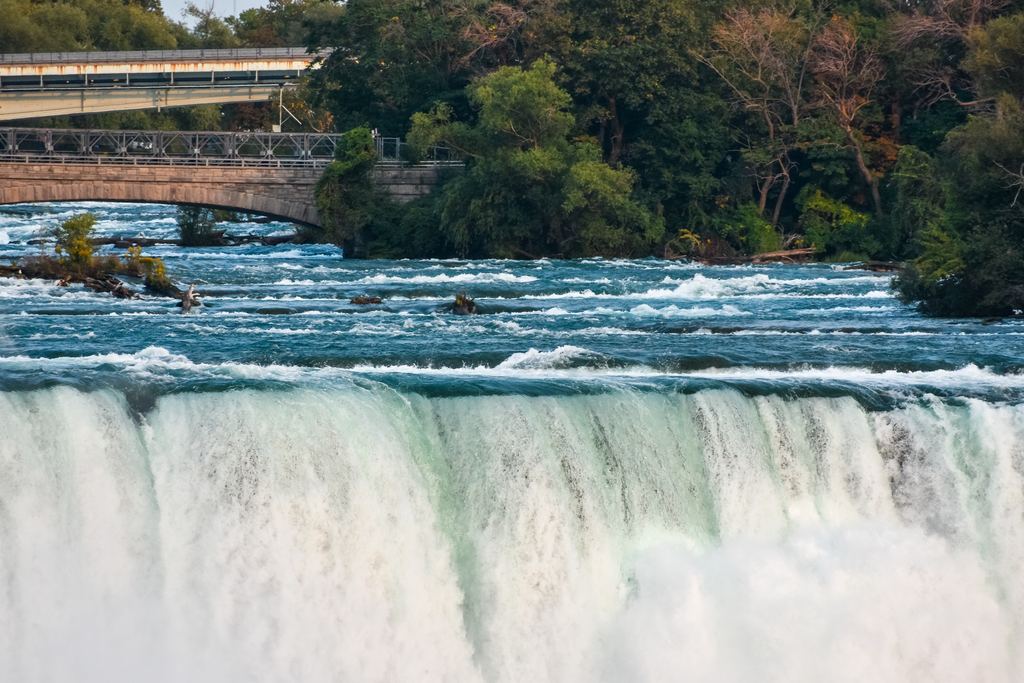
Start with Niagara. The USGS series is the flow into the river at Buffalo and not the water over the falls, which is set by a treaty and by control works. Niagara Parks says about 85 million liters a minute pass over the falls in winter and about 170 million from April to October. Our Niagara guide covers the rules behind that. The monthly table cannot see hour-by-hour changes either.
Gauges in streams sit above or below irrigation intakes and dams, and we did not verify how those shape the low months at Waimea or Honomanu. At Montmorency the gauge is 0.6 km below the Marches Naturelles dam, and we did not check the dam's effect either. Altitude is not corrected: Funchal sits on Madeira's coast and Marrakech on a plain, while the falls are higher up. The shape of the year carries over and the millimeters do not.
Distances matter too. Denpasar is on Bali's south coast and Sekumpul is in the north. The Quây Sơn, which feeds Ban Gioc, rises in China. The only station near La Fortuna that we could use sits on the other coast. Limestone basins such as Krka and Plitvice do not follow the rain of a single month: snowmelt, groundwater and lags blur it, and the Krka check above shows our estimate missing March.
Finally, the table says nothing about access. A fall can be full and the trail closed, or low and the pools right. For closures see what to do when a fall is closed or dry, and for ice and snow see our guide to snowmelt and frozen falls.
Can you rebuild it yourself?
Yes, in principle. We keep the raw station files, the gauge downloads and the pages we quote together with a script that turns them into the table without a network connection, and every number in it comes from one of those files, not from memory. The USGS and Water Survey series refresh every year, so we rerun it then and when a new set of climate normals appears. USGS notes that its statistics can differ from its official publications, which is why the table cites the service and the date.
How we are paid, and why a commission never moves a cell, is in the editorial policy. If you are choosing between tours and not between months, start with our guide to choosing a waterfall tour.
Quick answers
Why are 15 of the 21 rows only estimates?
Because most places have no open river gauge near the falls. Where one exists, the row uses it. Elsewhere we have rainfall at a weather station, and a rain calendar is the best we can publish without inventing flow.
Who chose the thresholds?
We did. The peak line is an index of 1.25 and the little-water line is 0.6, both against the average of the twelve months. No agency publishes them. Moving either one changes 4% to 6% of the cells in our working data.
Which rows are least reliable?
The leeward Hawaiian row, where the rain estimate matched measured flow in 3 months of 12, and the rows from Bali and Phnom Kulen, whose stations use records outside the standard period. Dunn's River is the least informative.
Data verified on . Gauge, station and park pages read on 2026-10-27; the table's numbers are in our working data. Check the official site or a live gauge before you go. Editorial Policy
Pick a place, then read its row
The destinations we cover are listed by country, with the months for each in the table.